

Dashboard
The new GenAI Dashboard provides a comprehensive view of assistant usage and performance metrics.
Overall Dashboard
The Overall Dashboard provides a clear summary of assistant usage and performance metrics, enabling users to filter and analyze data effectively.
Filter Options
Section titled “Filter Options”1. Filter by Assistant
- Default Setting: Displays the Top 9 assistants by usage, with all others grouped under “others.”
- Type: A searchable, multi-select dropdown list for easy assistant selection.
2. Filter by Date
- Default Setting: Displays data for the last 7 days from today.
- Type: Select a custom date range with a start and end date.
Assistant Performance
Section titled “Assistant Performance”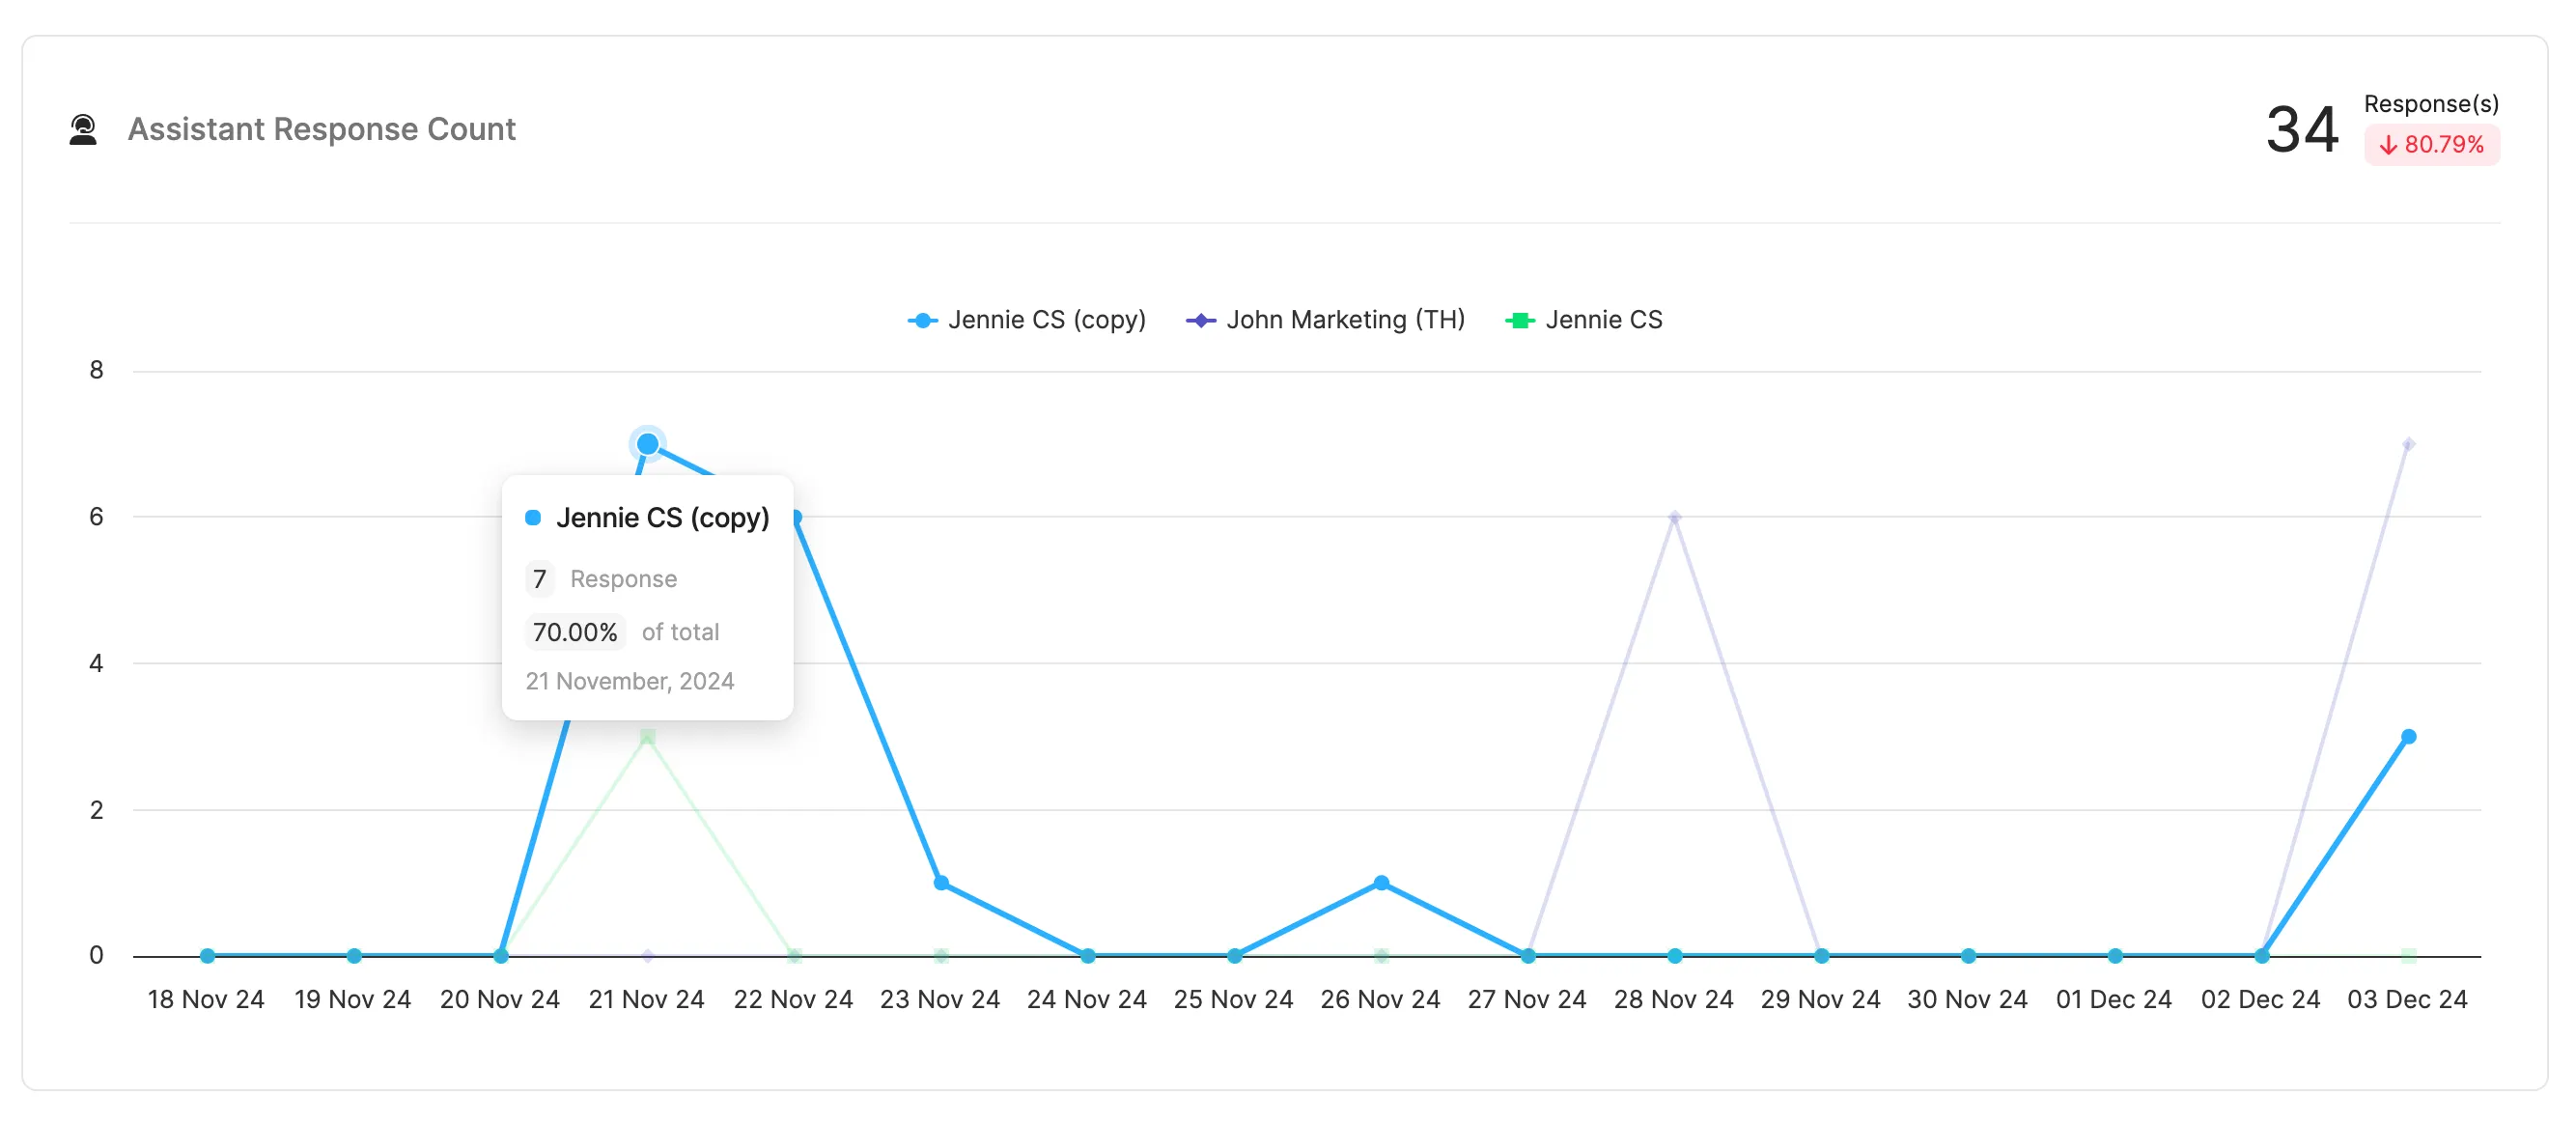
This section visualizes the total response count for each assistant and compares trends over time.
- Metric: Responses per assistant (unit: responses).
- Total Responses: The sum of all responses across all assistants (unit: responses).
- % Difference: Index to shows how much a value has increased or decreased compared to an earlier period (unit: %)
- Limitation: The chart can display up to 10 lines.
Memorized Response Coverage
Section titled “Memorized Response Coverage”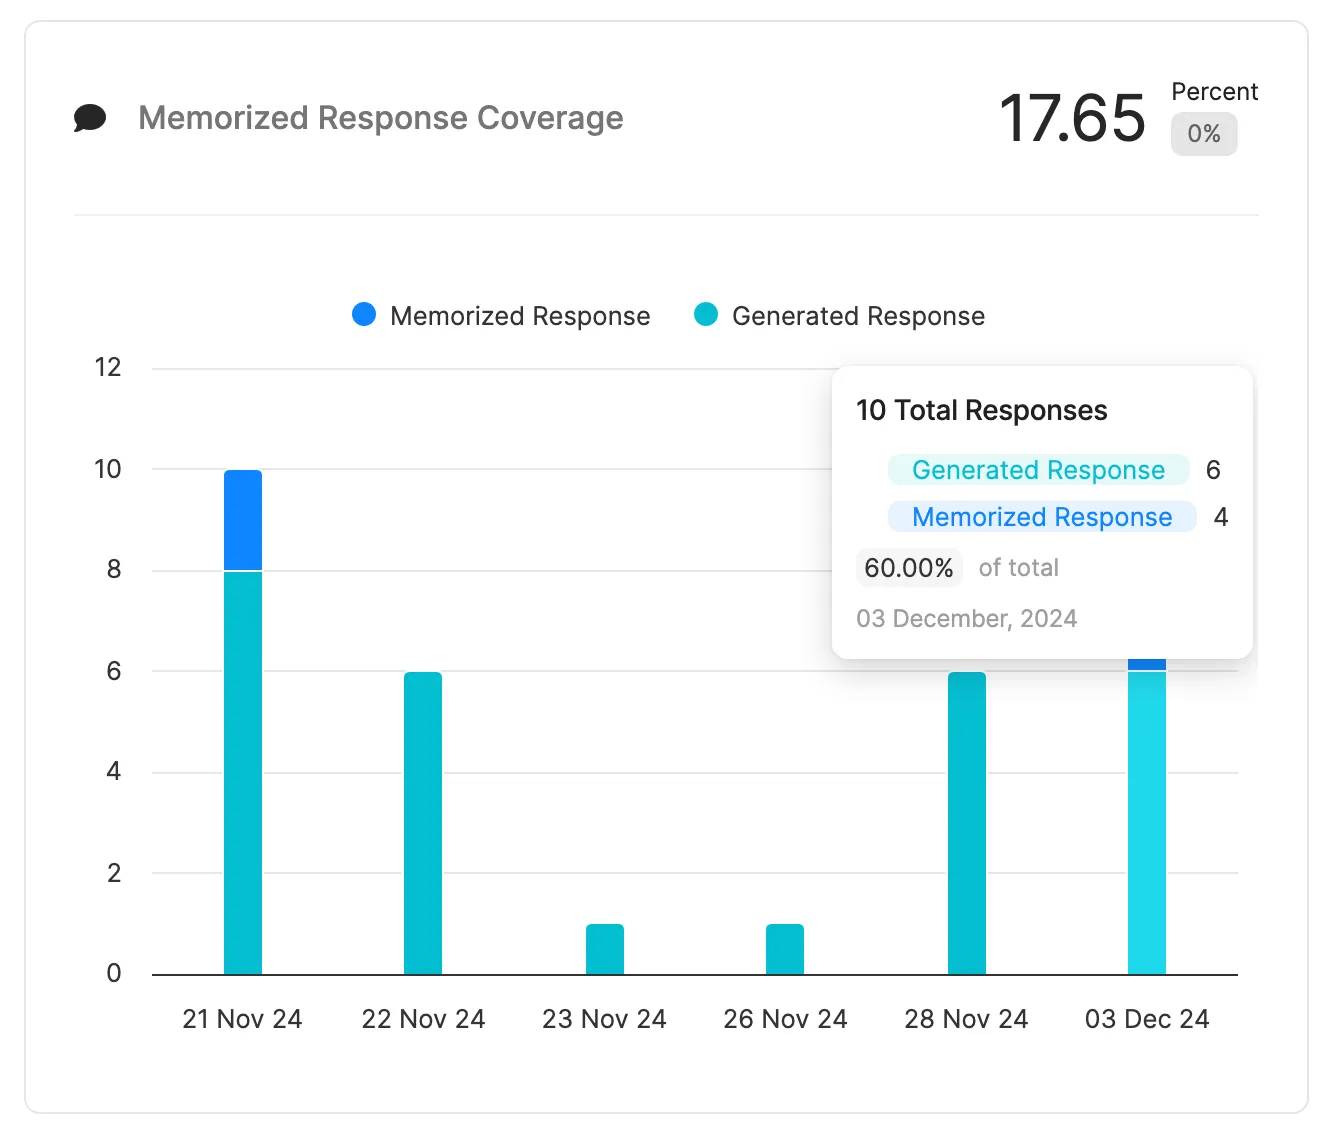
This section shows the proportion of reponses utilizing memorized responses.
- Memorized Response Coverage: Memorized Response ratio compared with Total of Responses (unit: %).
- Memorized Response: Responses that used memorized responses (unit: responses).
- Generated Response: Response that did not use memorized responses (unit: responses).
KM Coverage’
Section titled “KM Coverage’”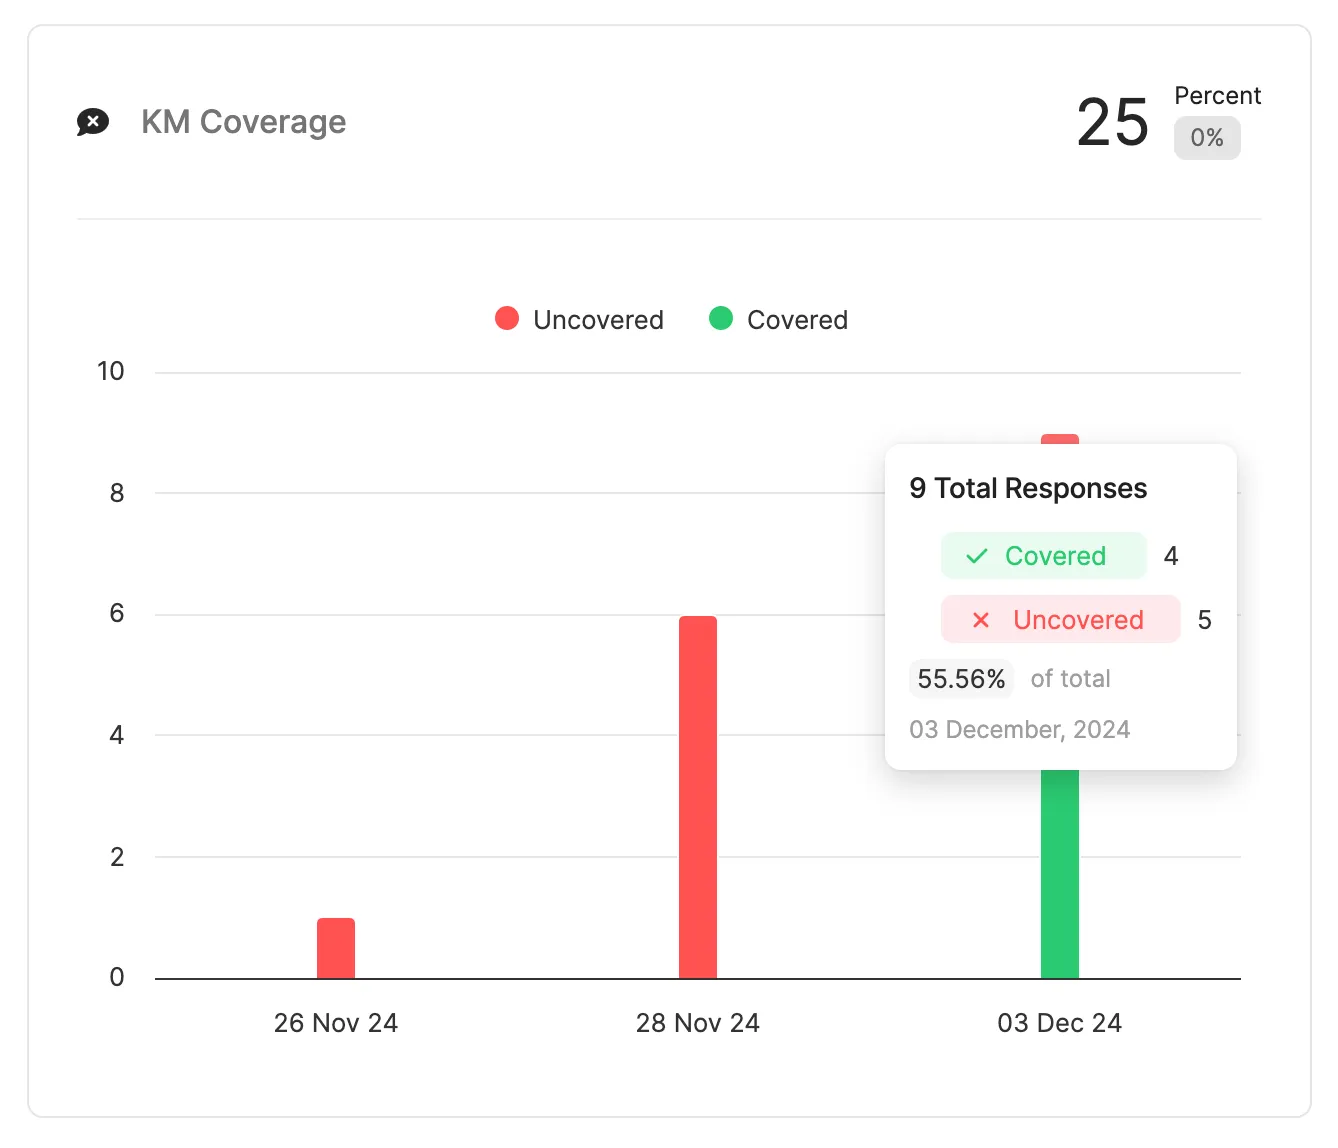
This section provides insights into response utilizing Knowledge Management (KM) for generating responses.
- KM Coverage: KM Response ratio compared with Total of Generated Responses (unit: %)
- Covered Responses: Responses that used KM to generate responses (unit: responses).
- Uncovered Responses: Responses that did not use KM to generate responses (unit: responses).
Was this page helpful?
Thank you for your feedback!